Learn More About How to Prevent Heat Loss in Your Home
Did you know that up to 35% of your home’s heat loss occurs through the walls? Roofs, windows, doors, and garages make up the remaining 65%. Identifying and addressing these problem areas is key to improving energy efficiency, lowering heating costs, and increasing comfort in your home.
Using thermal imaging technology, we can visually detect where heat is escaping. Thermal images clearly highlight areas of poor insulation, air leaks, and thermal bridging, allowing you to take targeted action to seal gaps and improve insulation.
Understanding Thermal Imaging Readings
A thermal imaging gun provides temperature readings in degrees Celsius or Fahrenheit, helping to identify areas of heat loss. Ideally, your home’s exterior temperature should be as close as possible to the outdoor air temperature, meaning minimal heat is escaping.
Problematic Readings
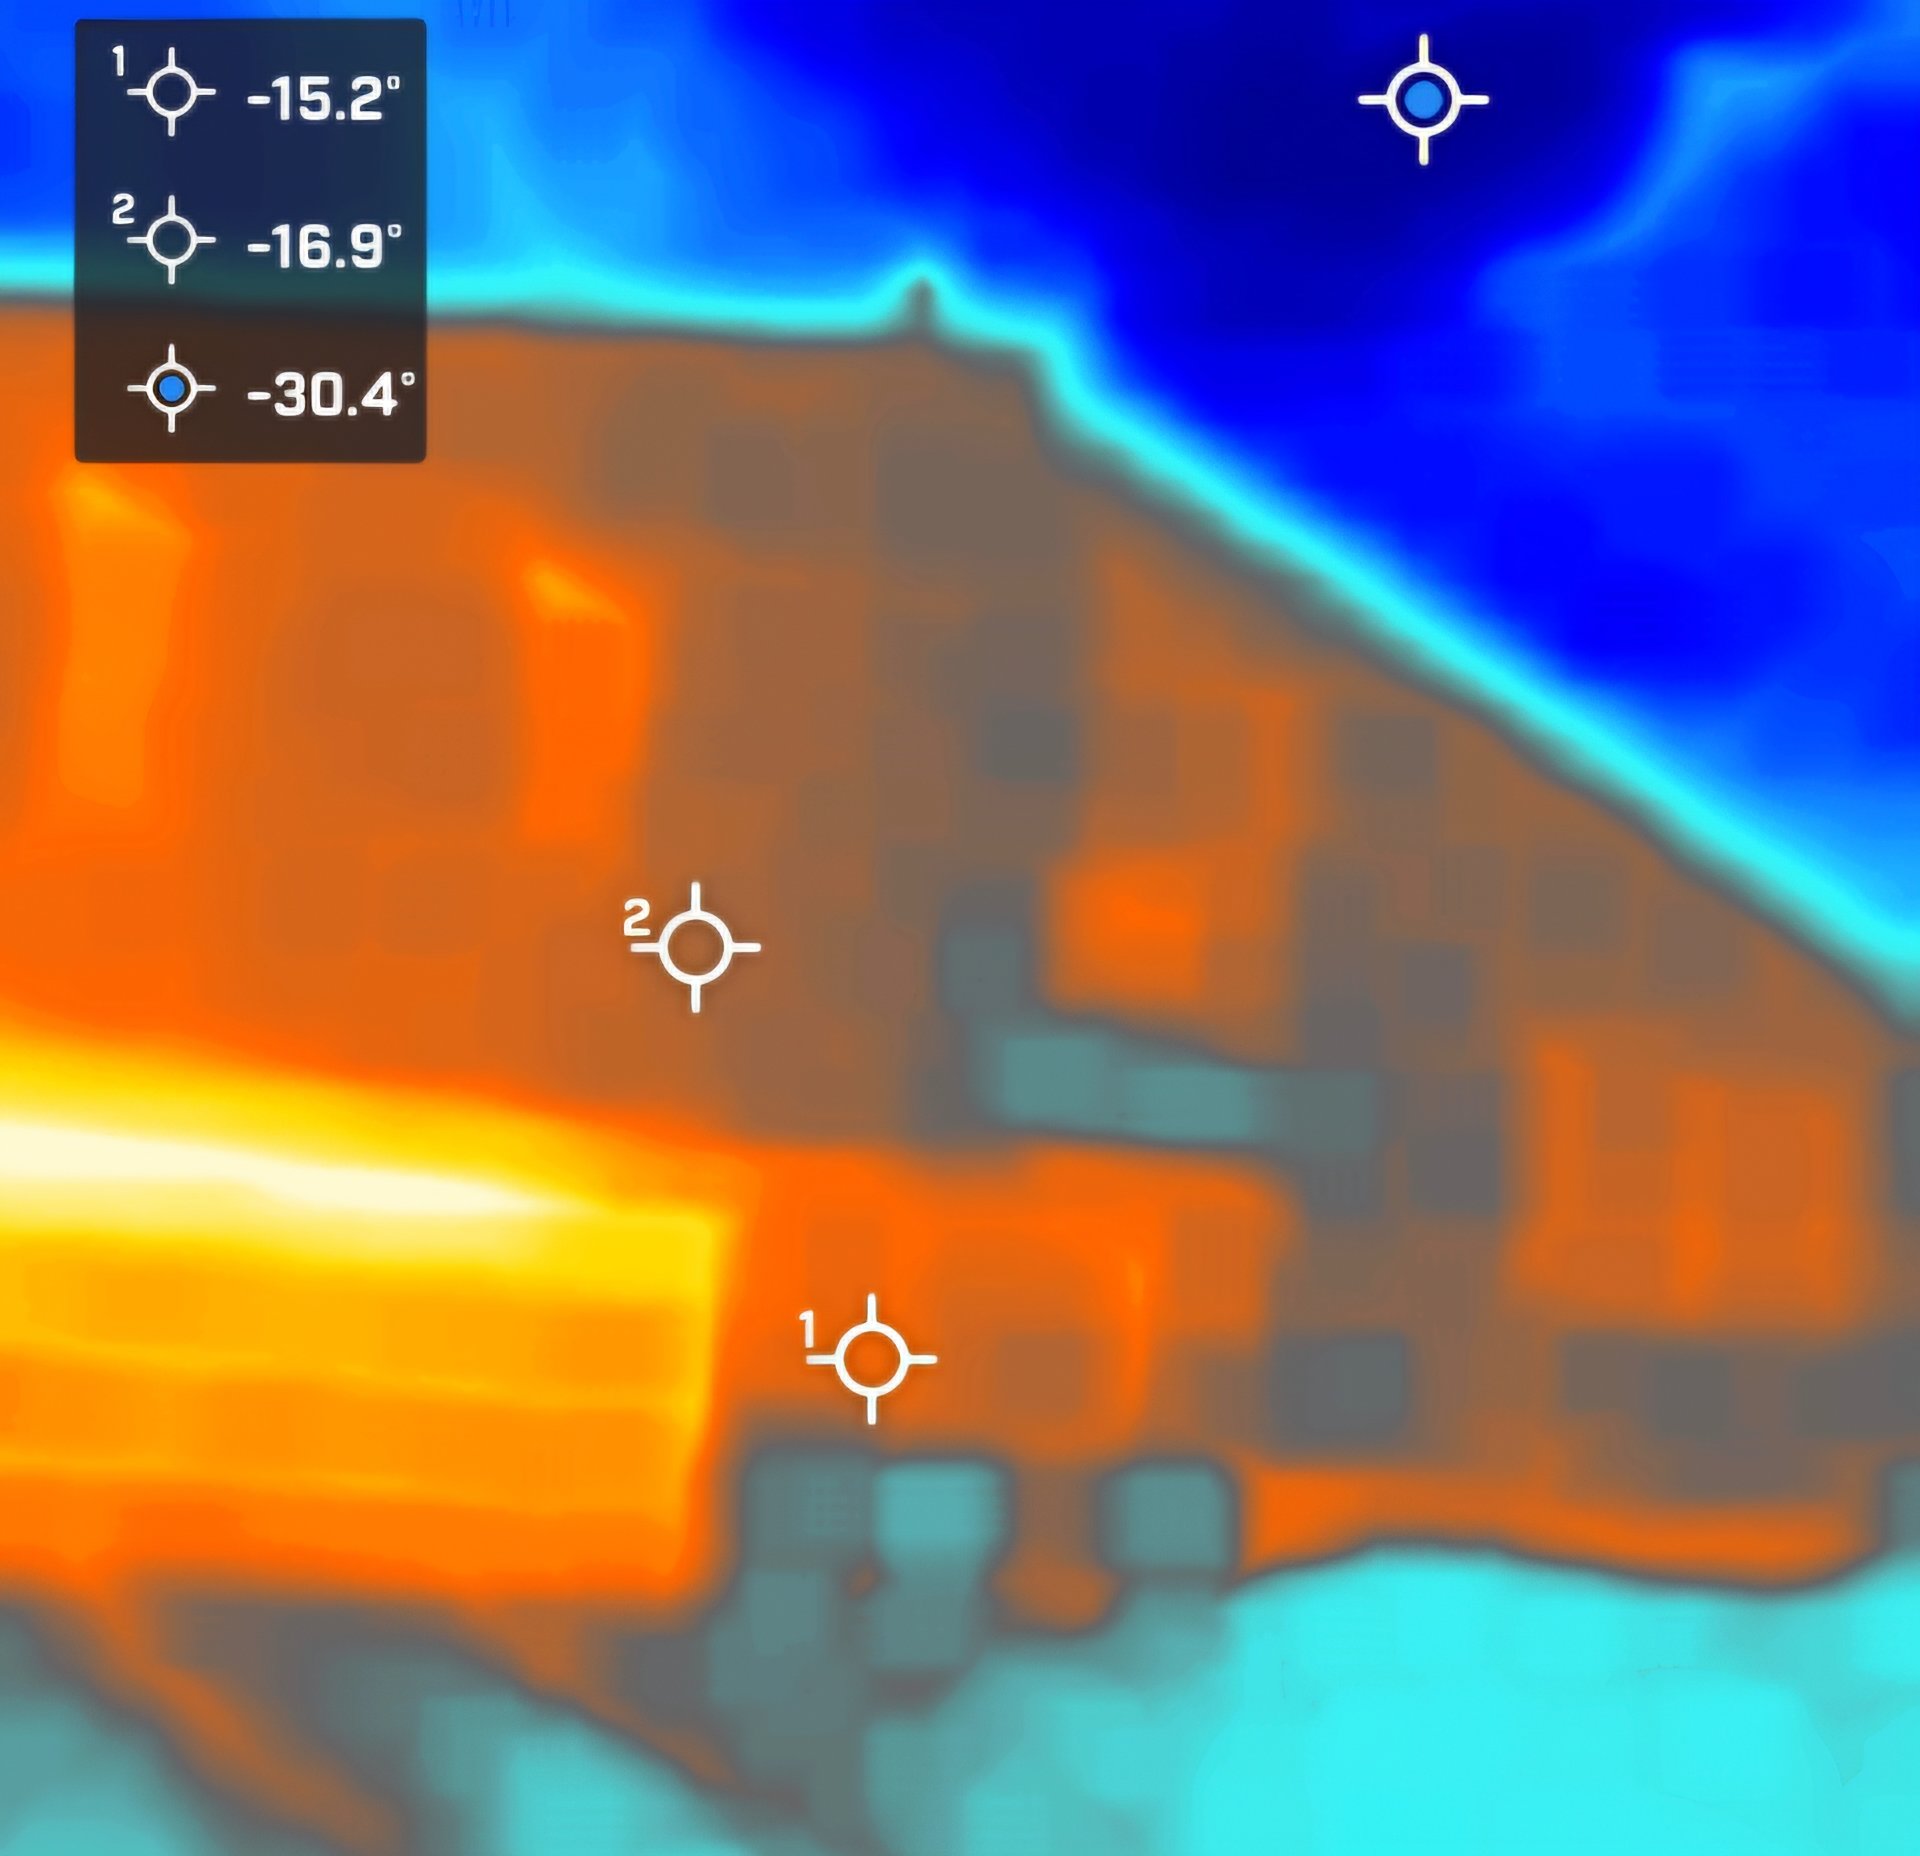
If areas of your home show temperatures 5°C (9°F) higher than the outside temperature in winter, this indicates significant heat loss. This not only increases heating bills but also adds strain to your heating system, reducing its lifespan.
The inverse is true in summer—if your home is 2-3°C cooler than the ambient temperature, your air conditioner is working too hard, leading to unnecessarily high energy bills.
Ideal Readings
If your home’s exterior temperature is very close to the actual outdoor temperature, heat loss is minimal, and you have a highly efficient home.
Pitfalls of Thermal Imaging
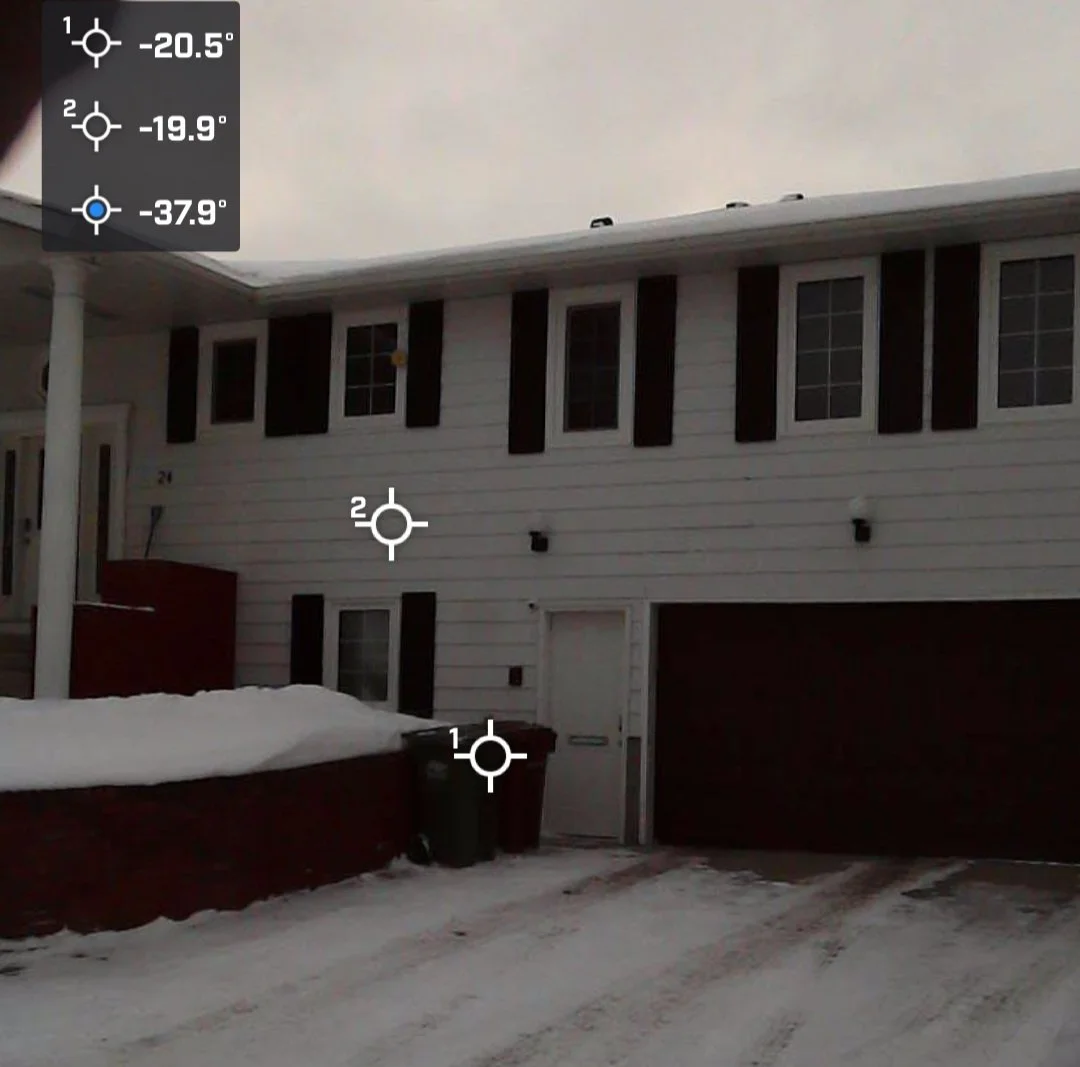
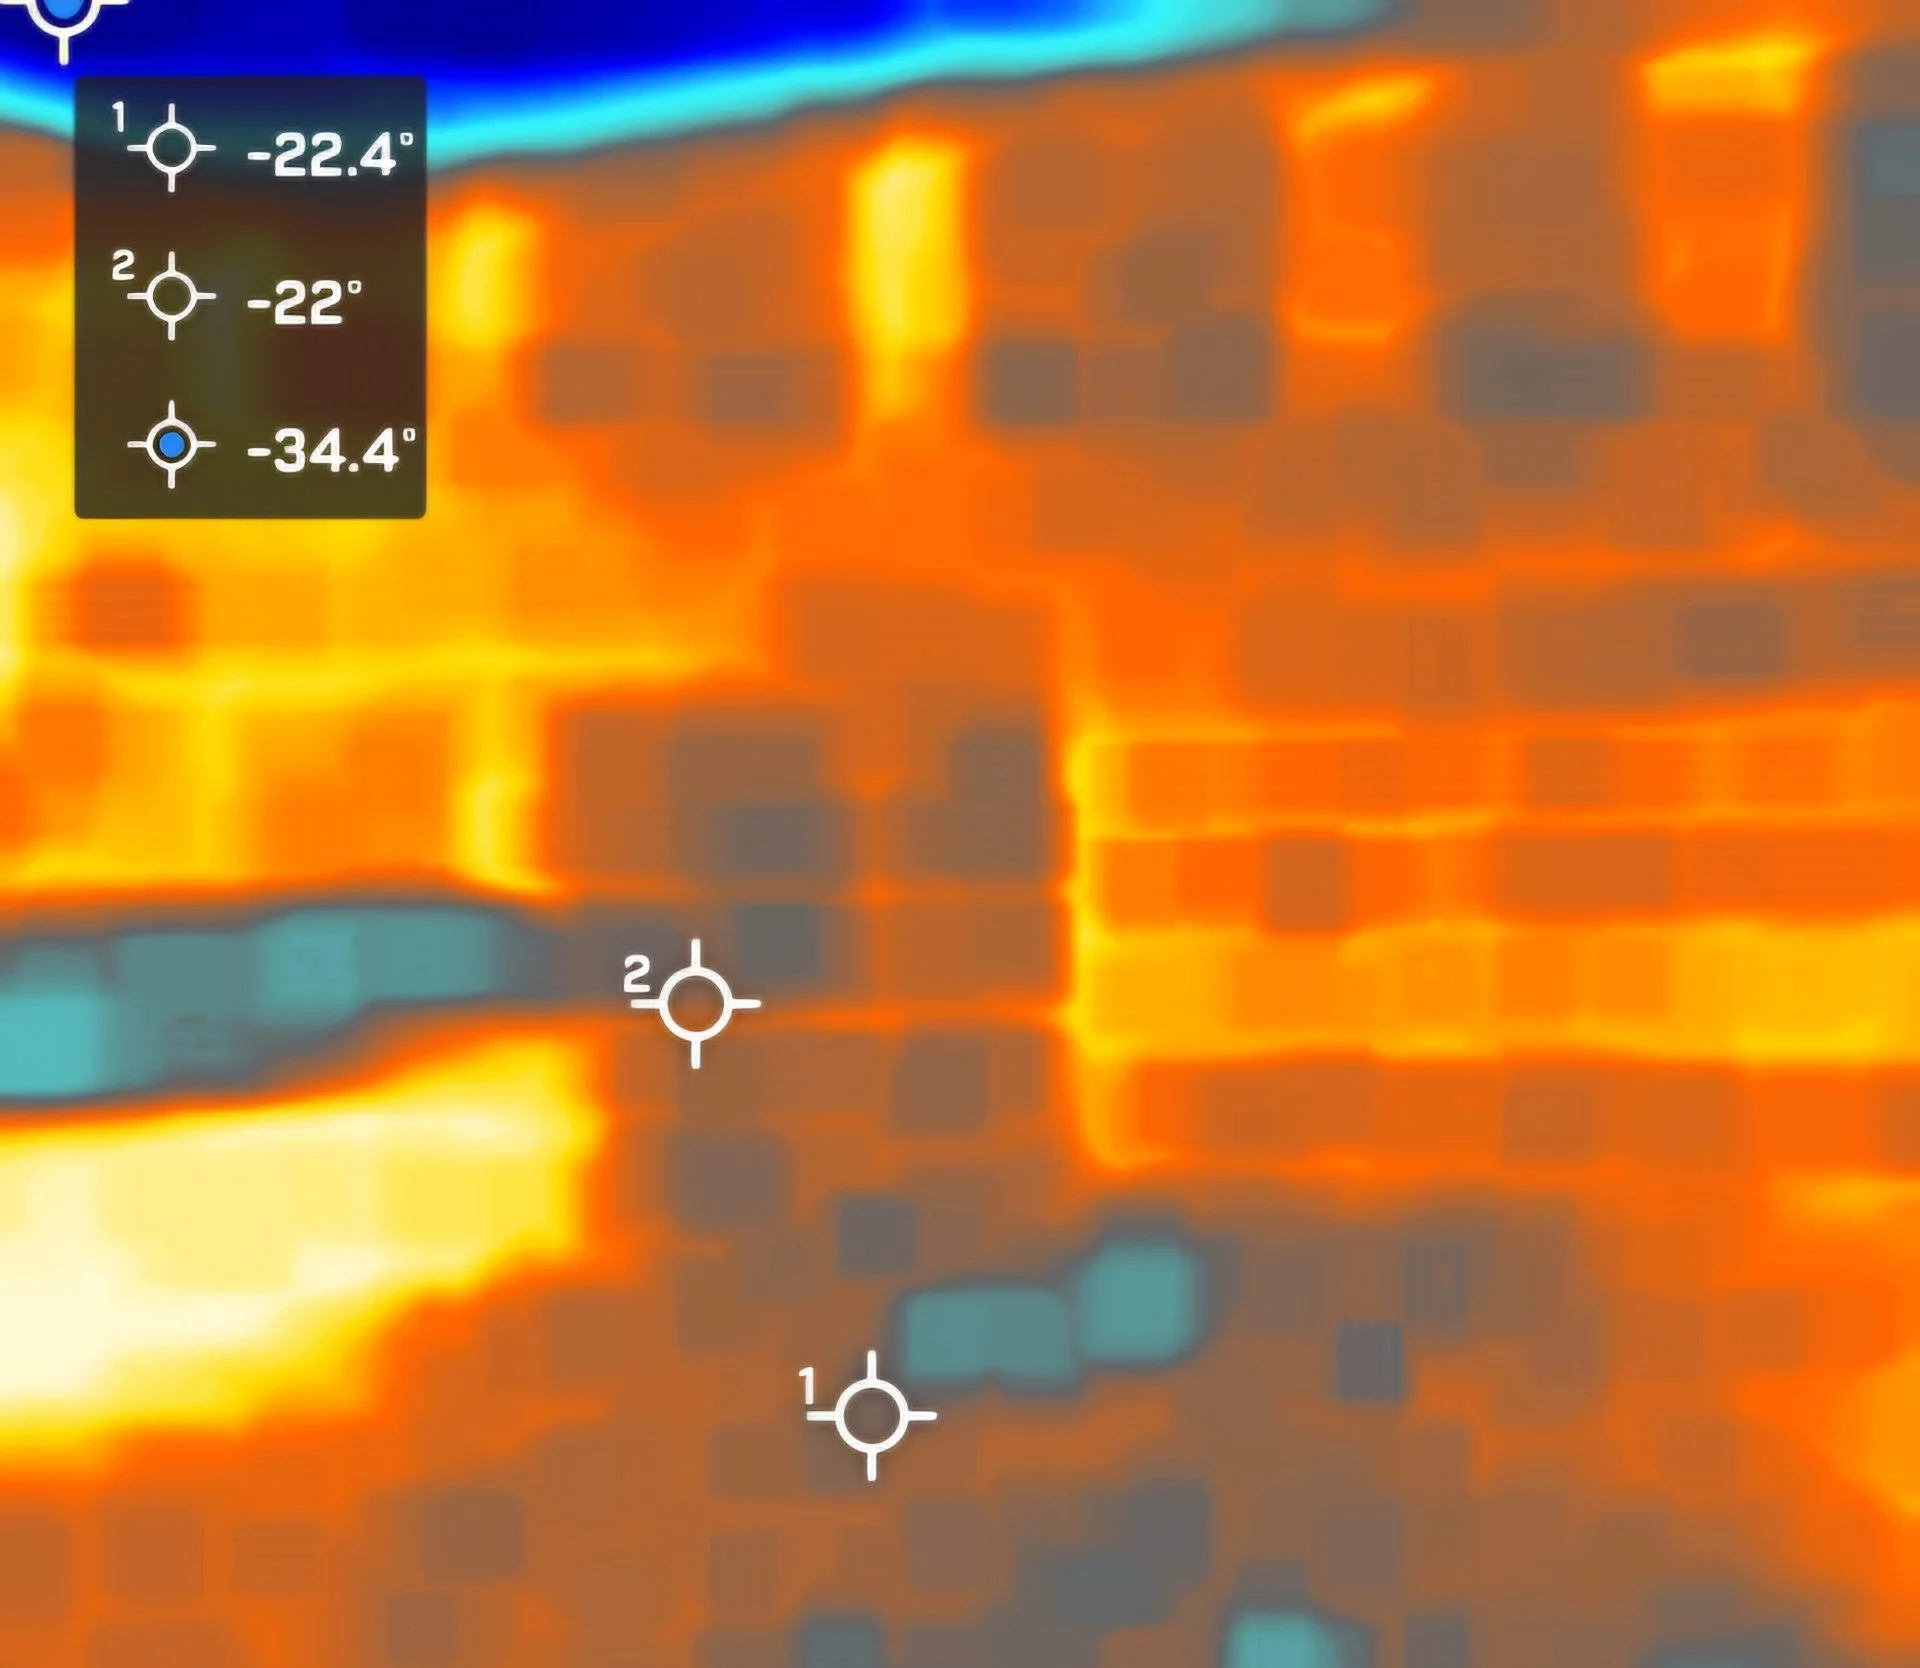
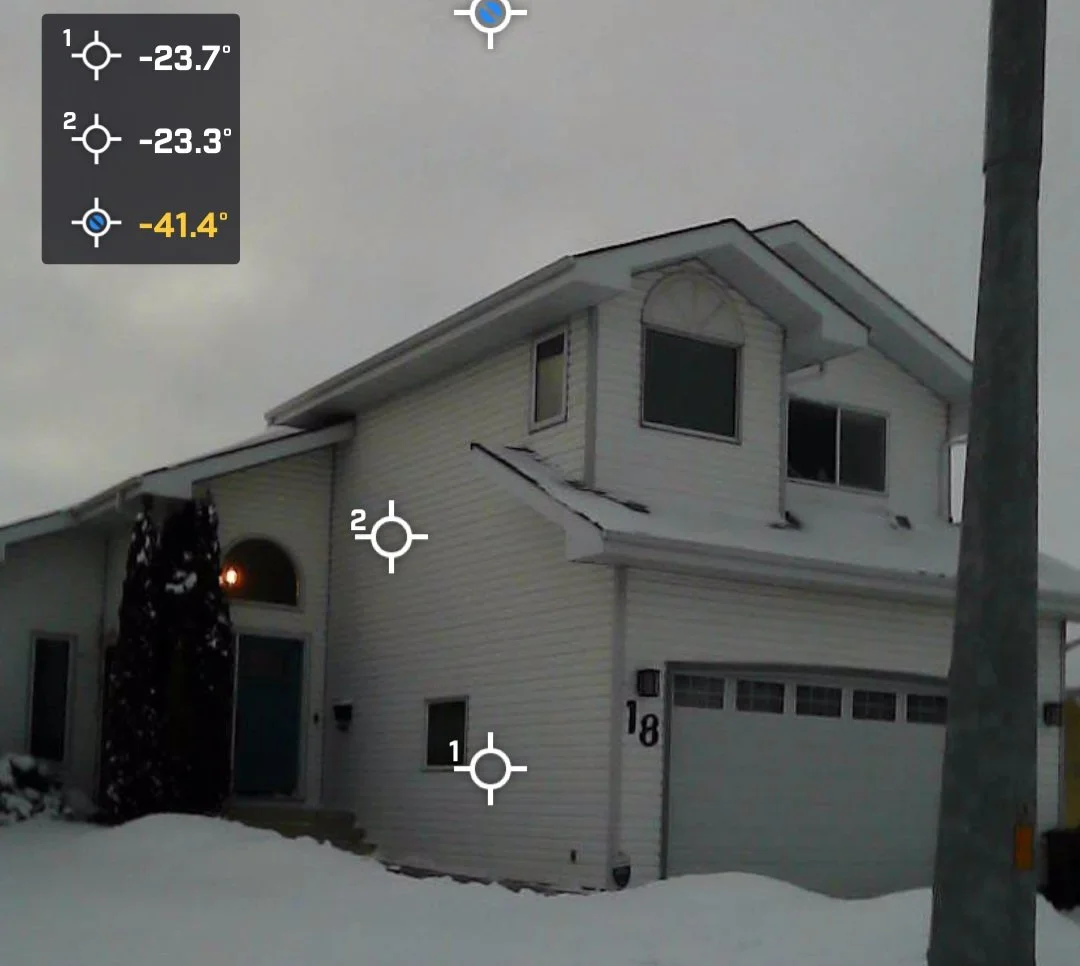
Dark surfaces on sunny days absorb heat, which can skew thermal imaging results. This is shown in the image below, where the trash can appears to emit as much heat as the home. To ensure accuracy, it’s important to remove external heat sources, such as direct sunlight.
For best results, thermal images should be taken on overcast days, in the shade, or after sunset. Be cautious—misrepresentation is easy! Always ask for representative images taken under proper conditions to ensure reliable data.
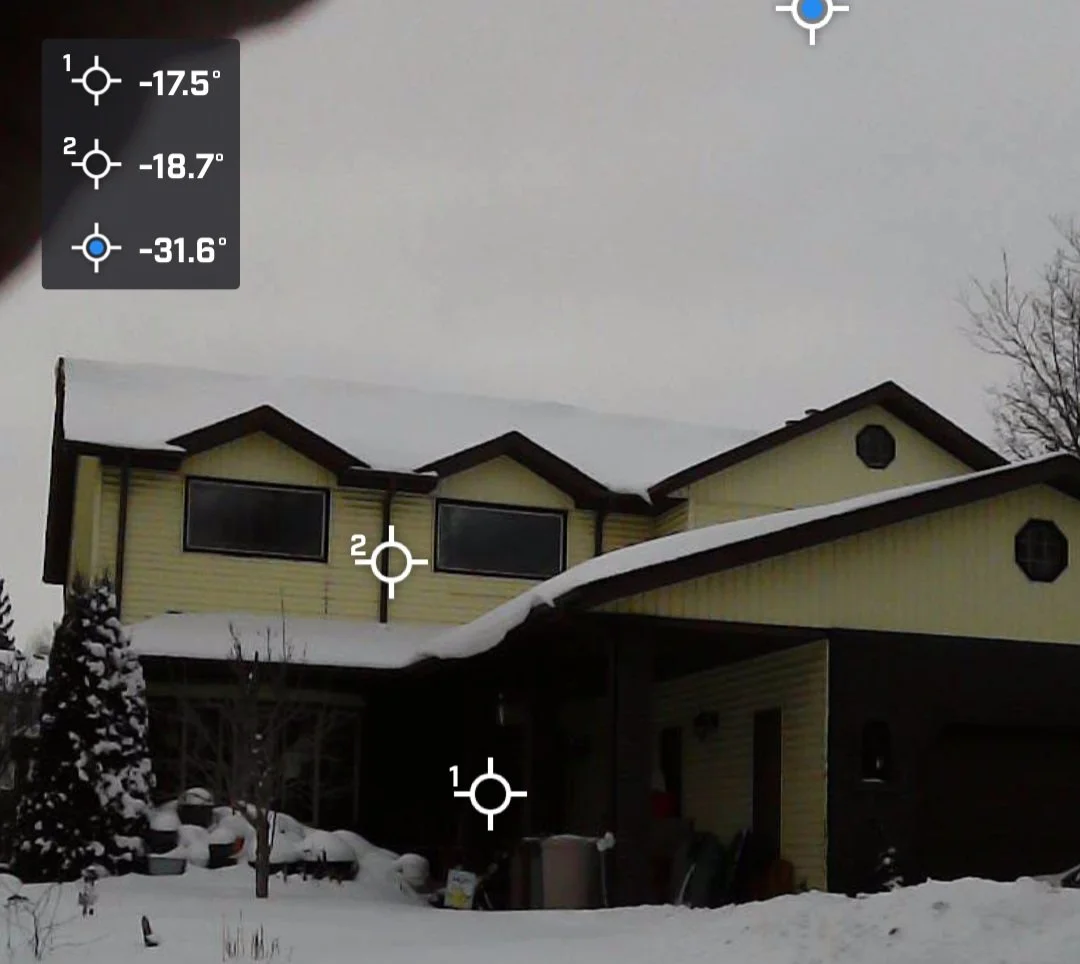
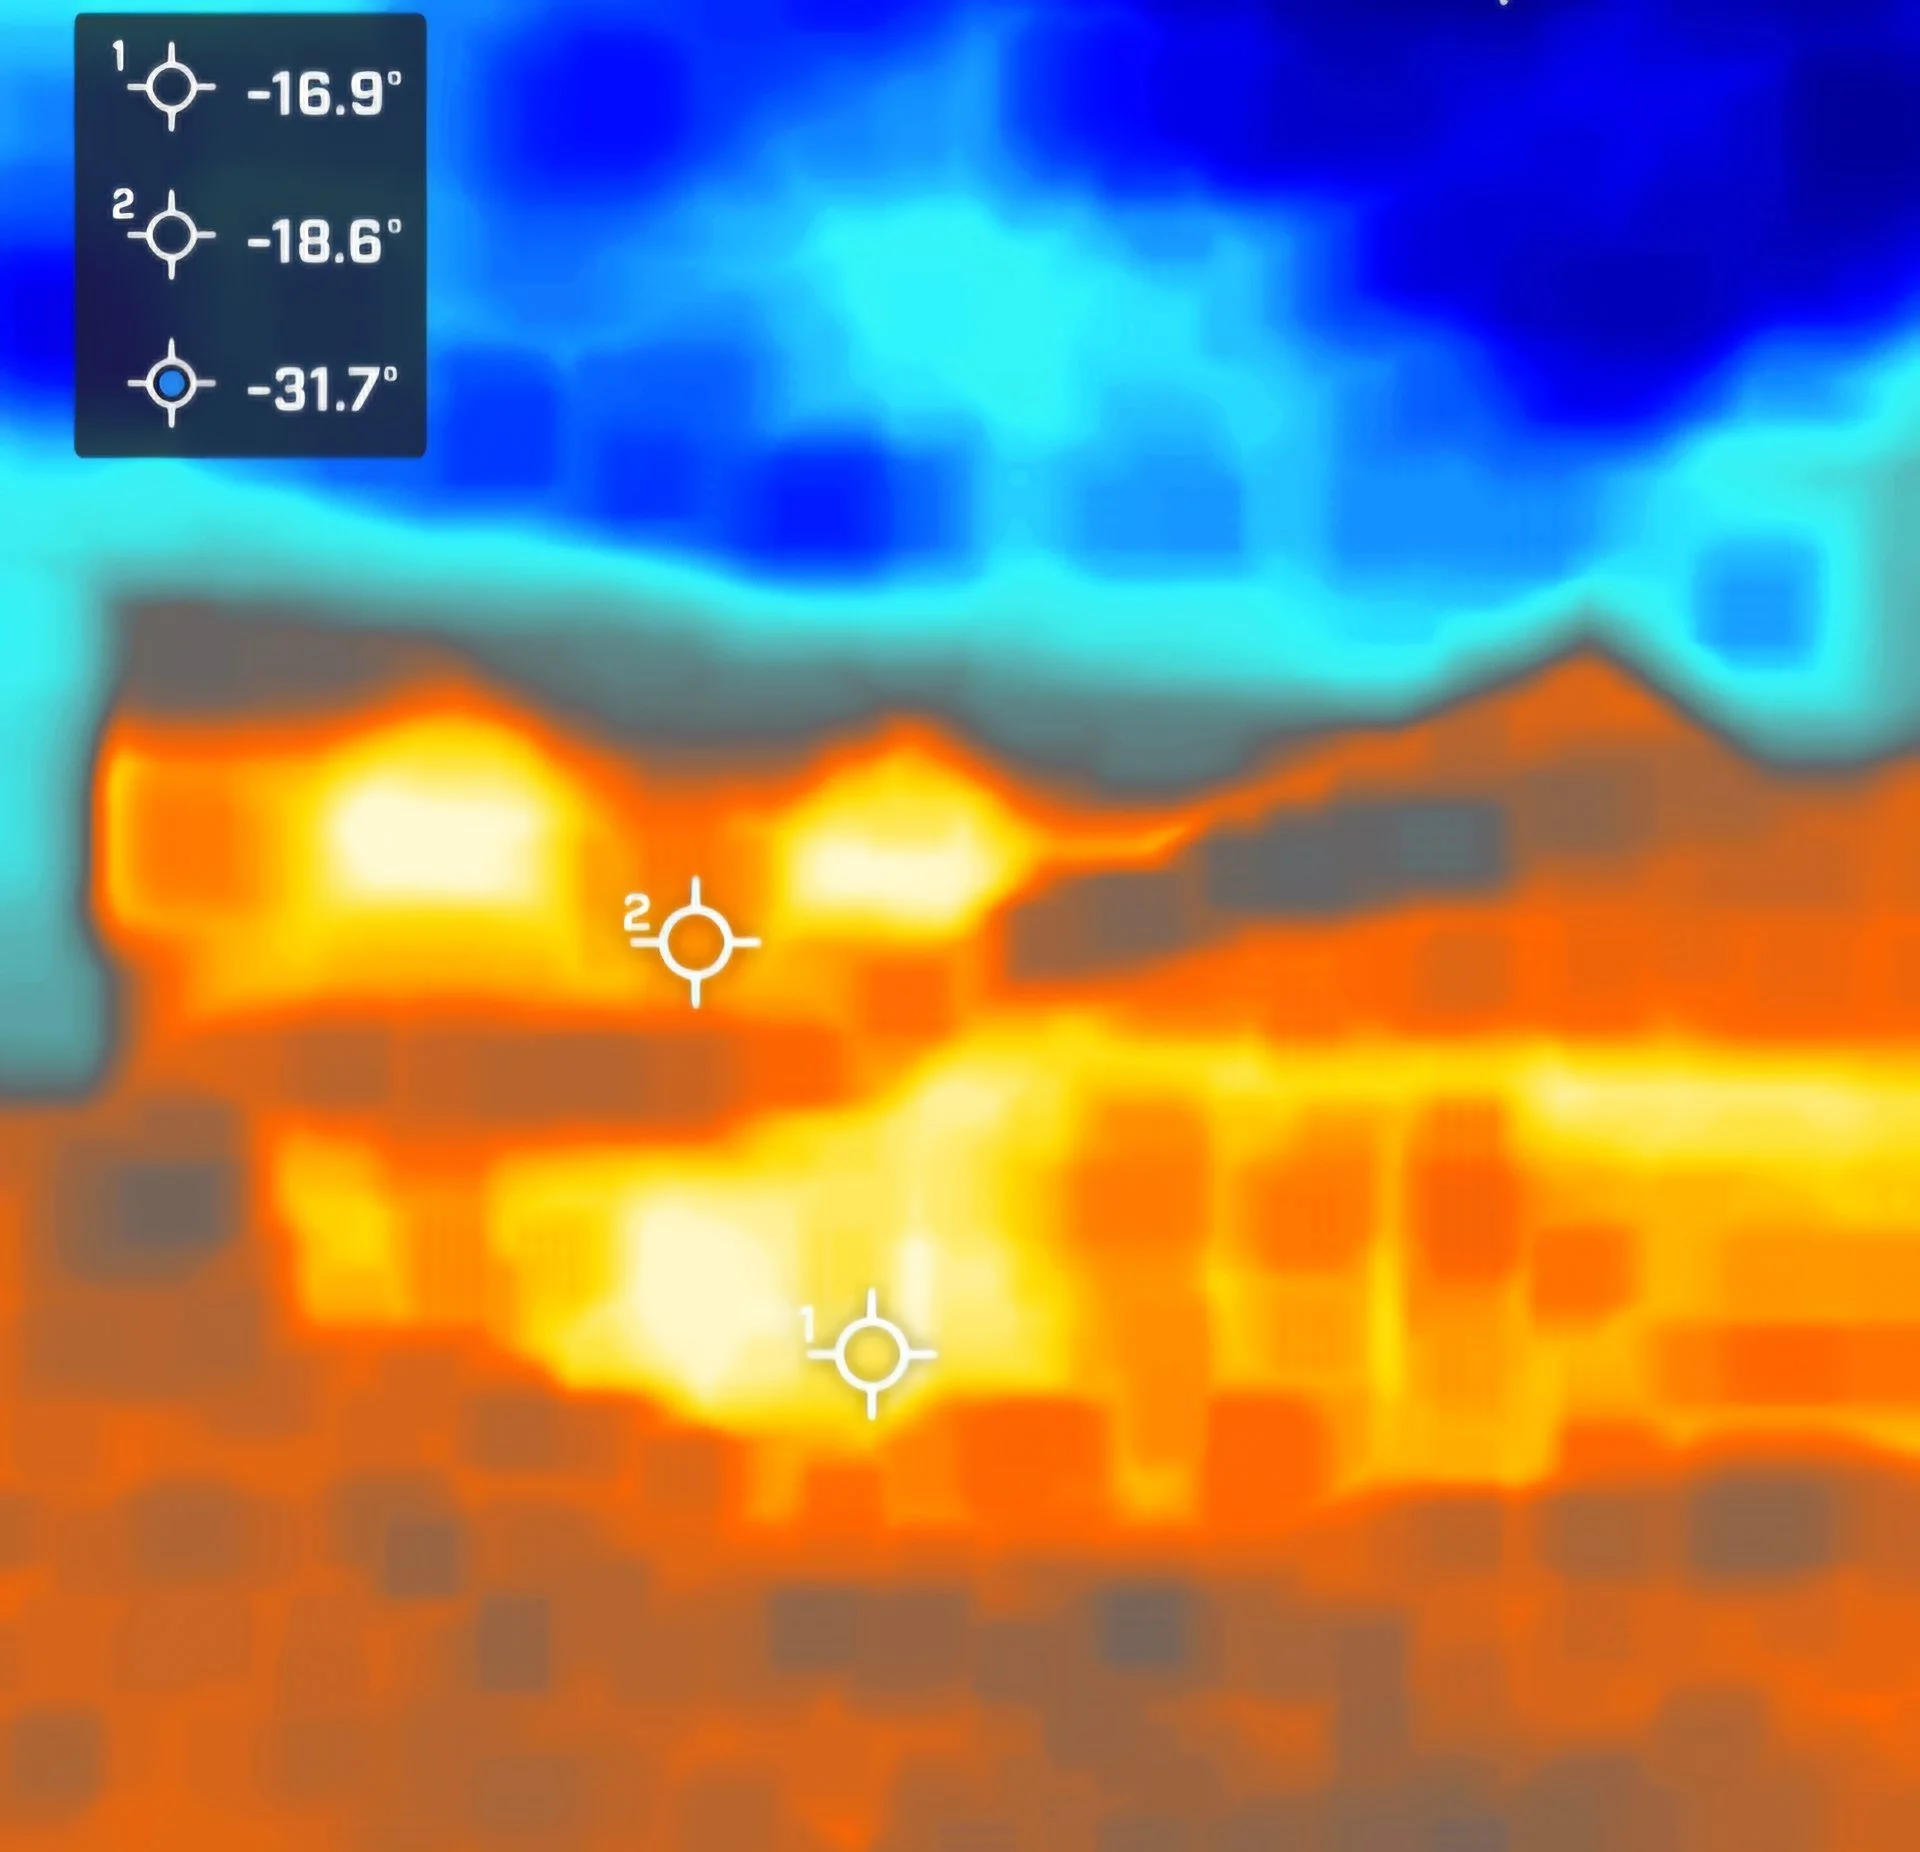
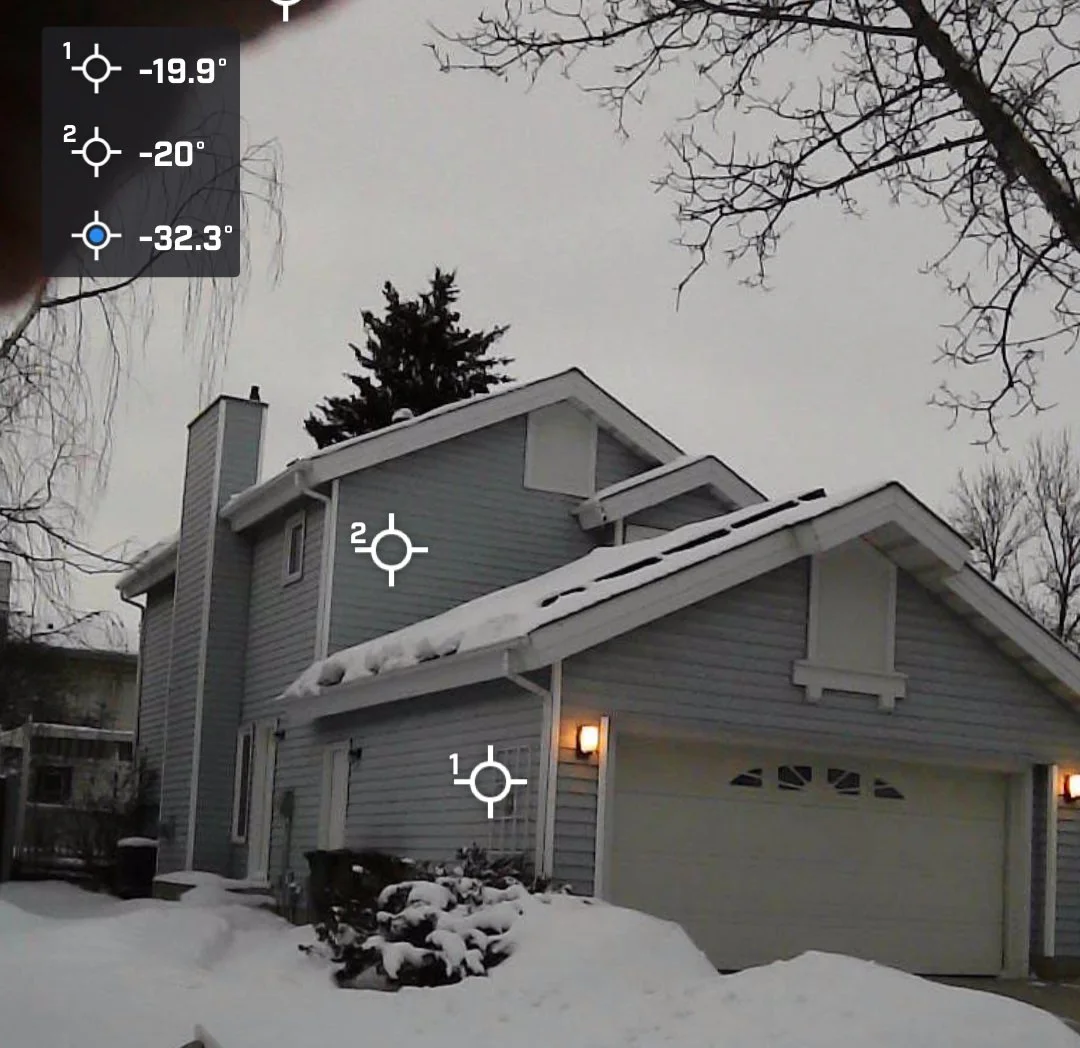
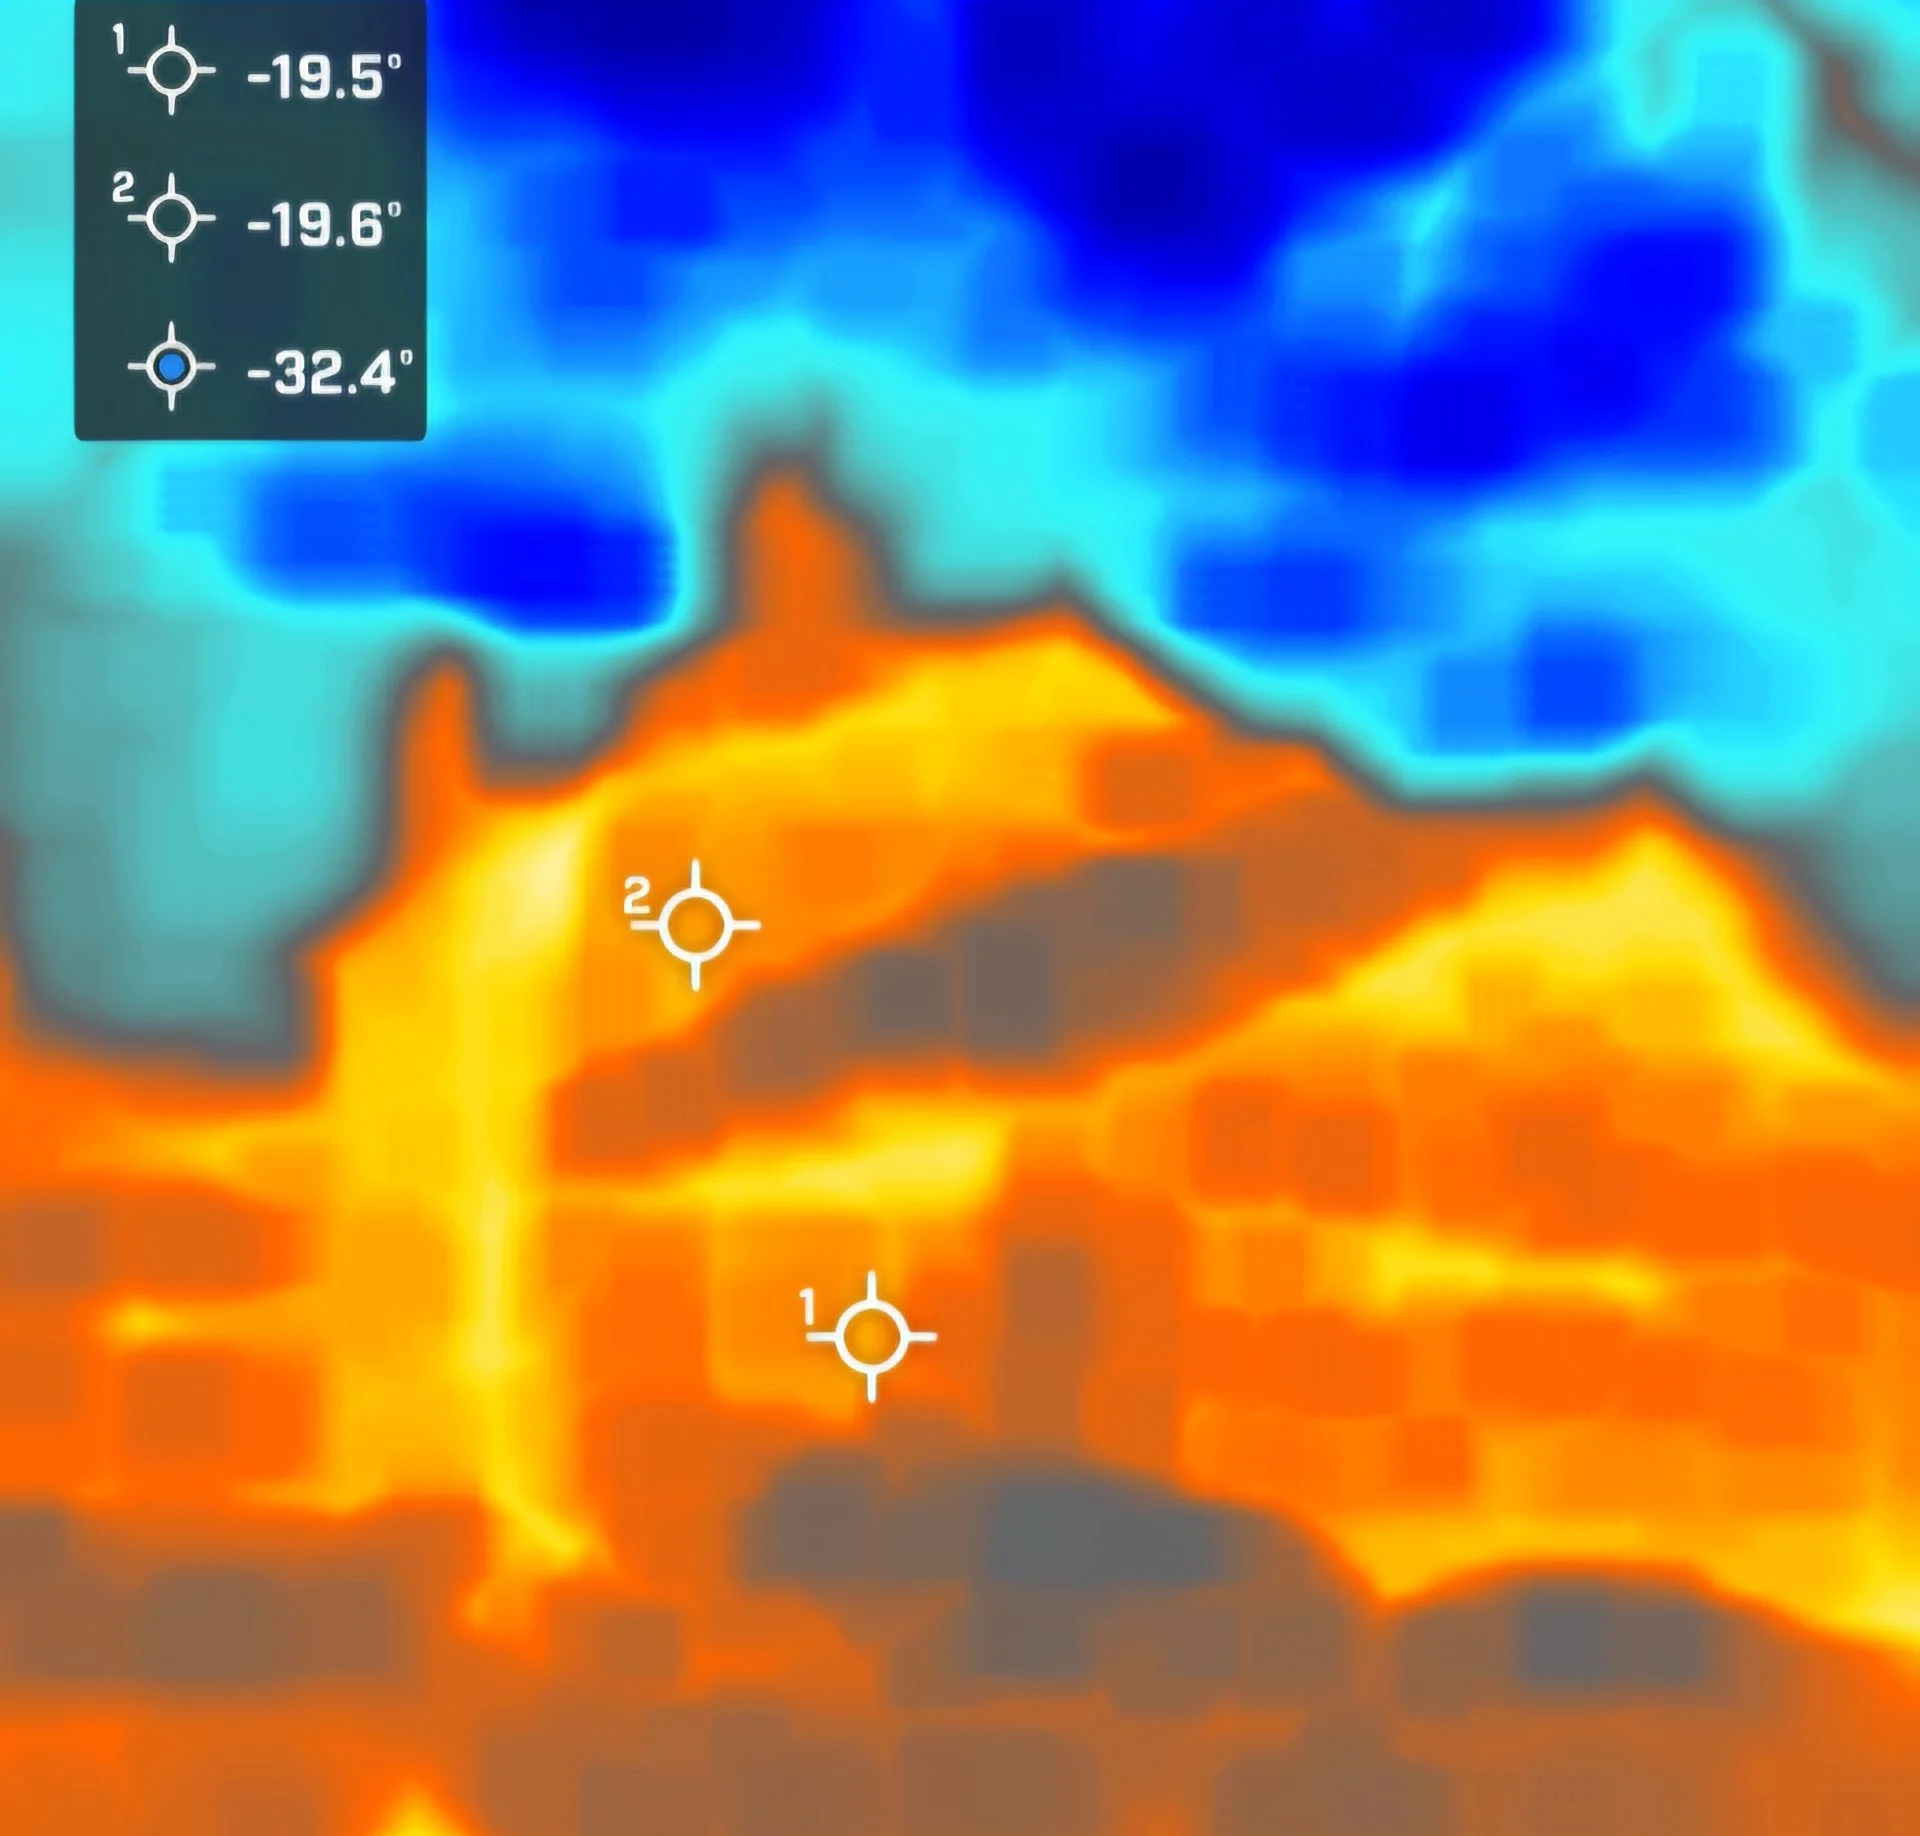
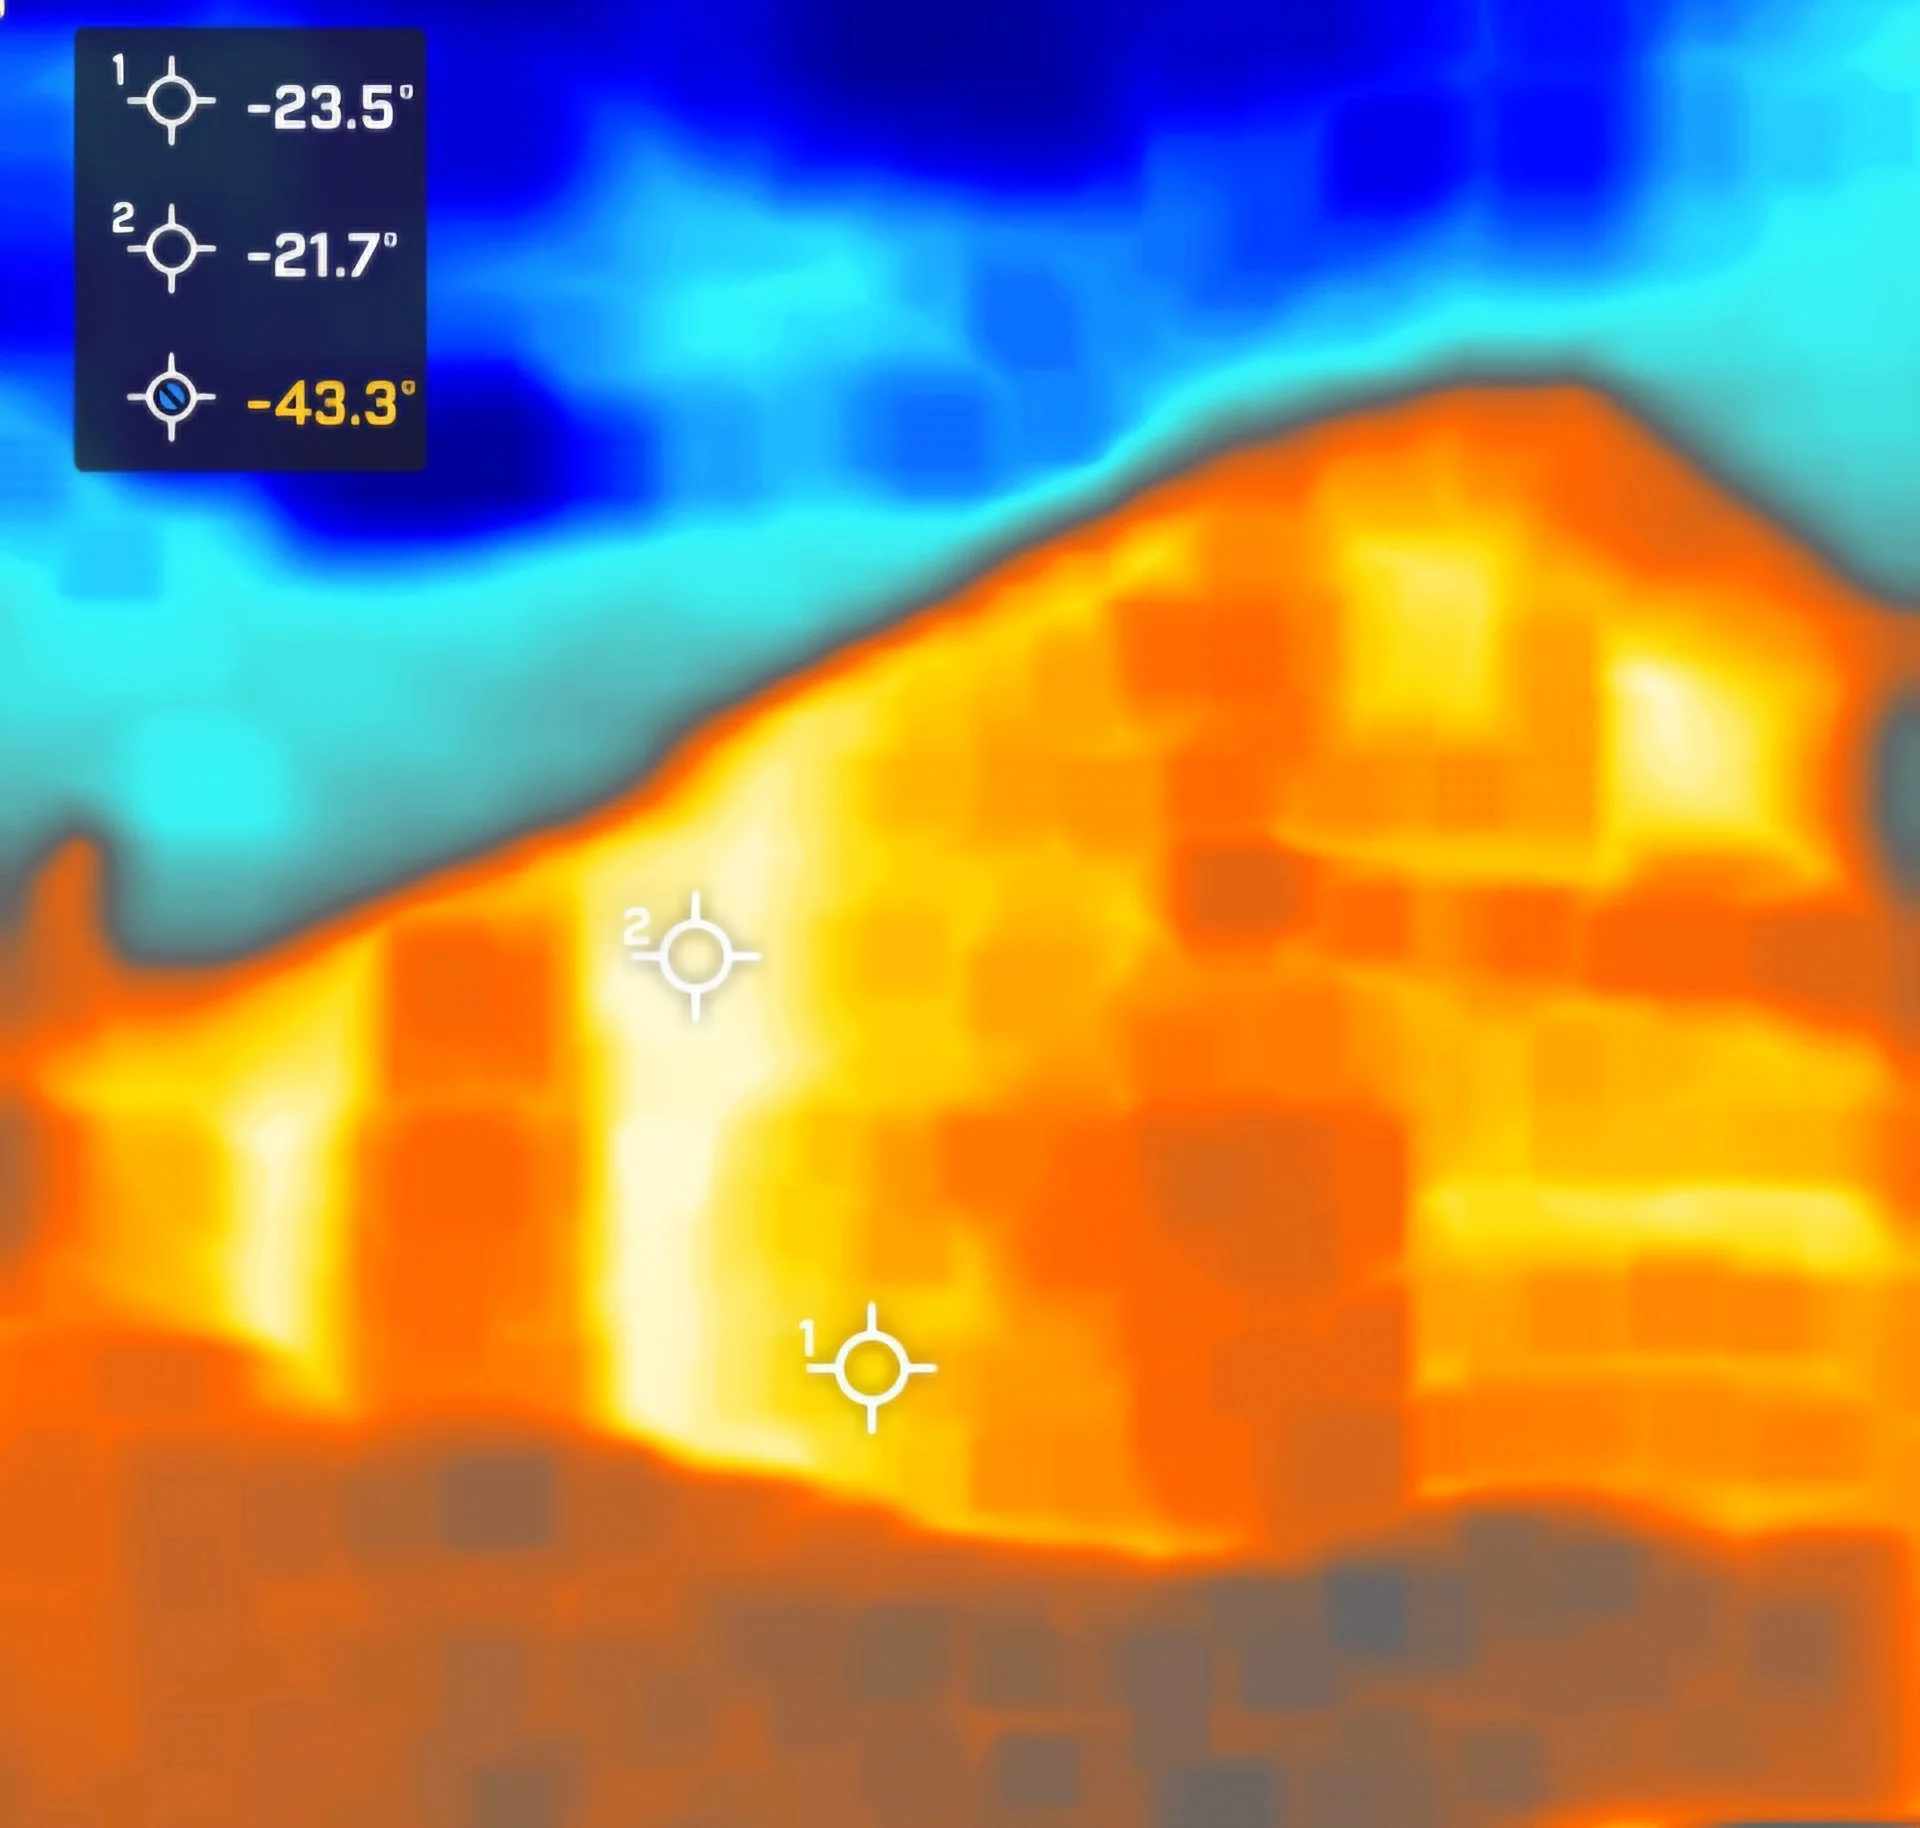
How to Read the Images Below
In the images below, you’ll find thermal gun readings displayed alongside each home’s thermal scan. The legend in the top left corner indicates the temperature readings for the marked points on the image (Pointer 1 & Pointer 2, recorded in Celsius). The third value in the legend represents the outside environmental temperature, providing a reference point for heat loss comparison.